
Food hygiene ratings by area: council comparisons
Explore the published hygiene ratings of food businesses across 361 UK council areas. Find the strongest results, the areas with more low ratings and the differences between business types.
Find your area- Council areas covered
- 361All four UK nations
- Council-register records
- 614,978Snapshot: 7 November 2026
- FHRS businesses rated 0–2
- 3.03%England, Wales and Northern Ireland
Newham has the highest share of ratings of 0–2
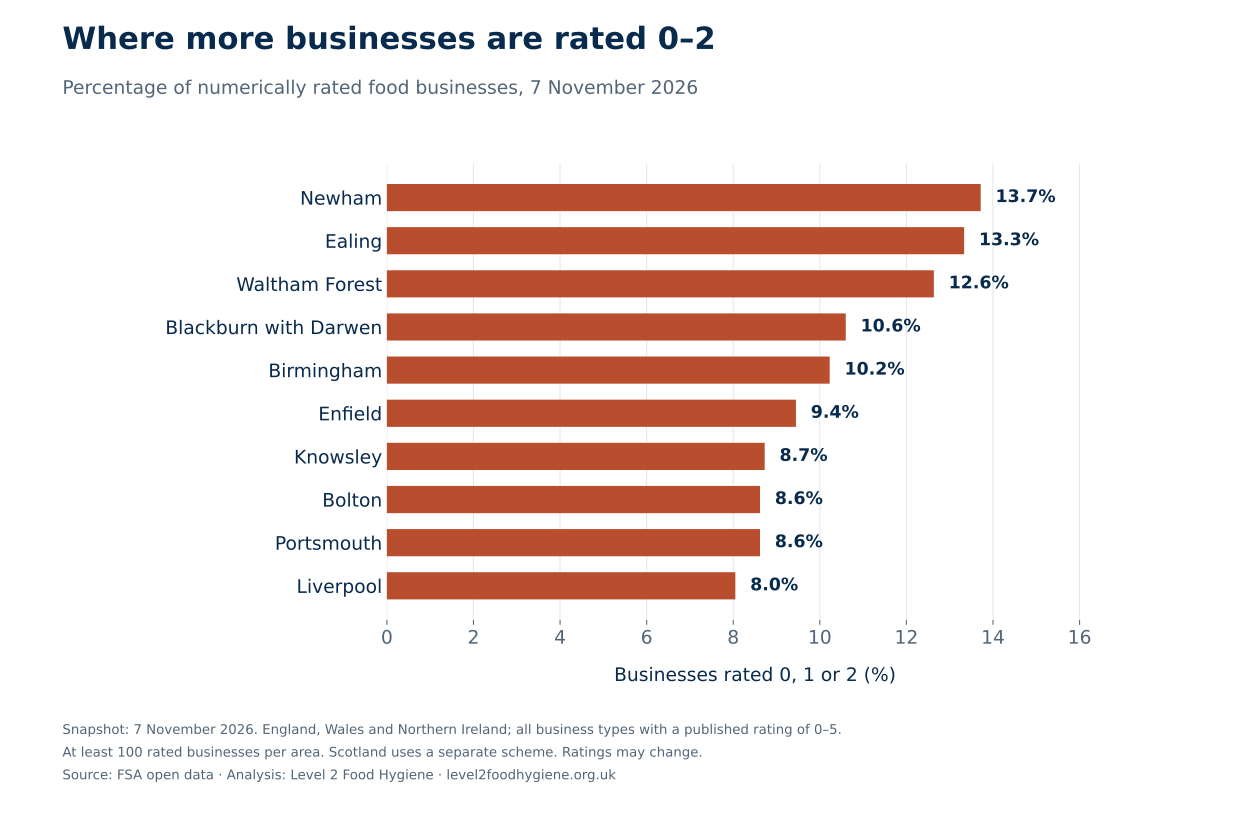
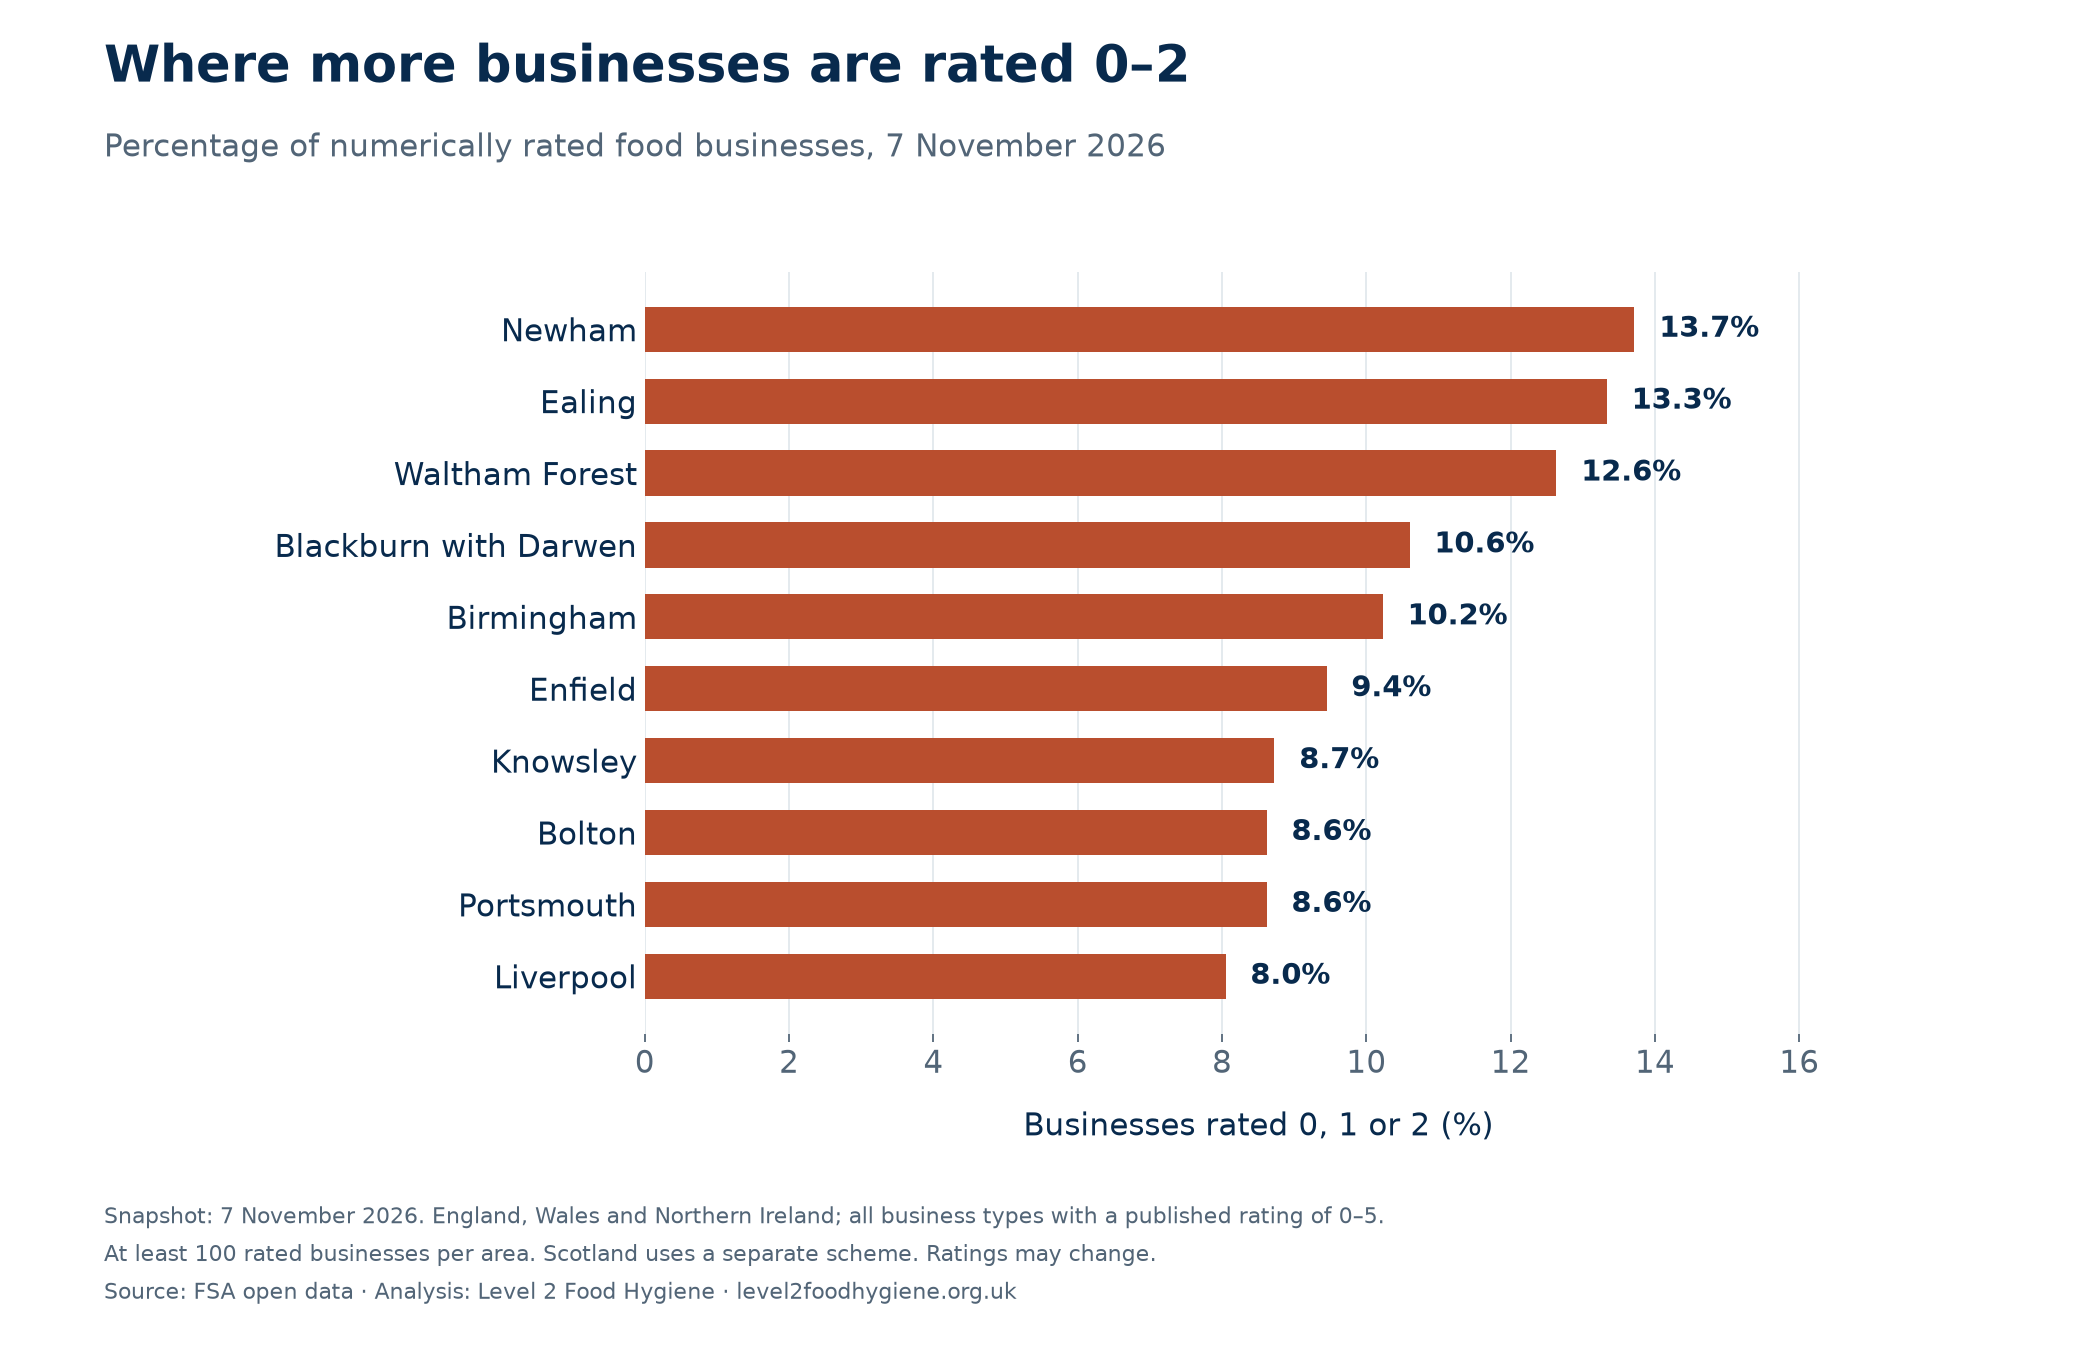
337 of Newham’s 2,457 numerically rated food businesses were rated 0, 1 or 2 in the 7 November 2026 snapshot: 13.72%. Ealing followed at 13.33% and Waltham Forest at 12.63%.
Across England, Wales and Northern Ireland, 14,842 of 489,519 rated businesses fell into these categories, or 3.03%. These are the published ratings that call for improvement, major improvement or urgent improvement.
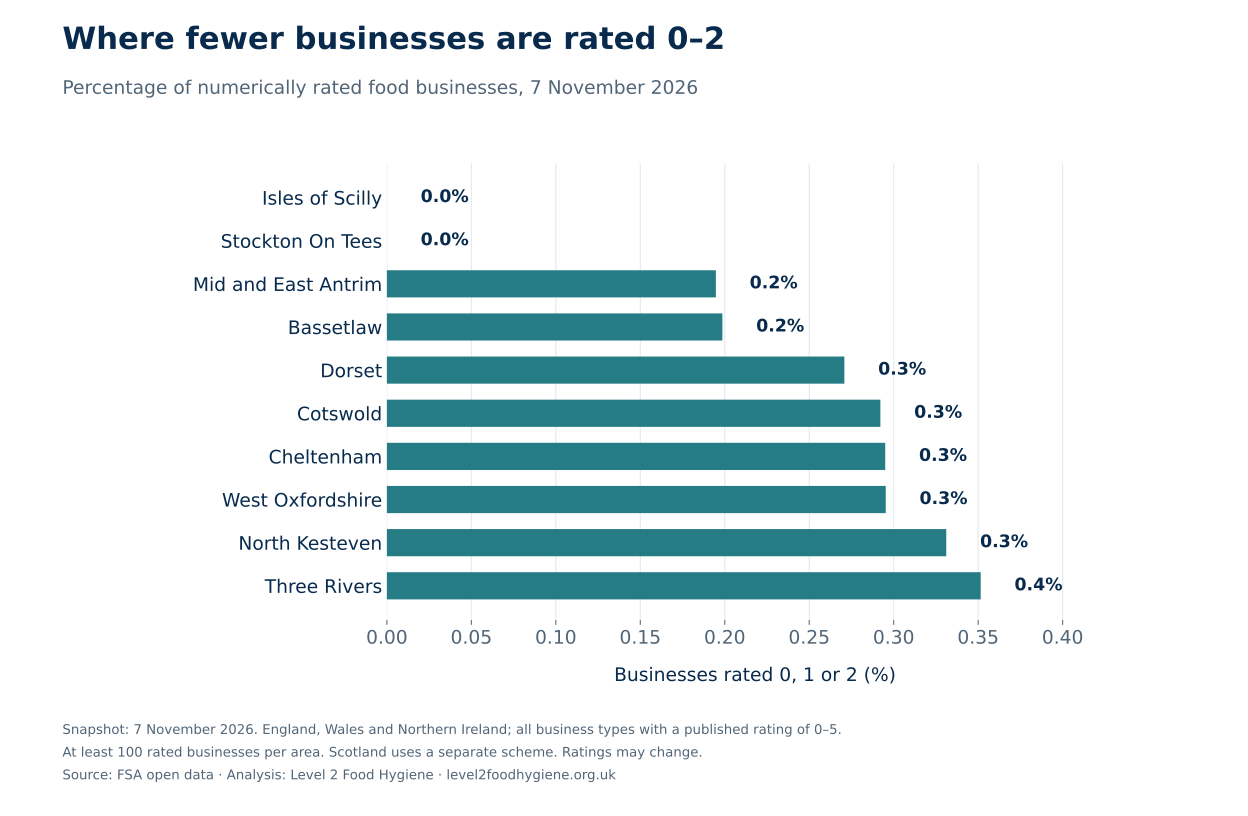
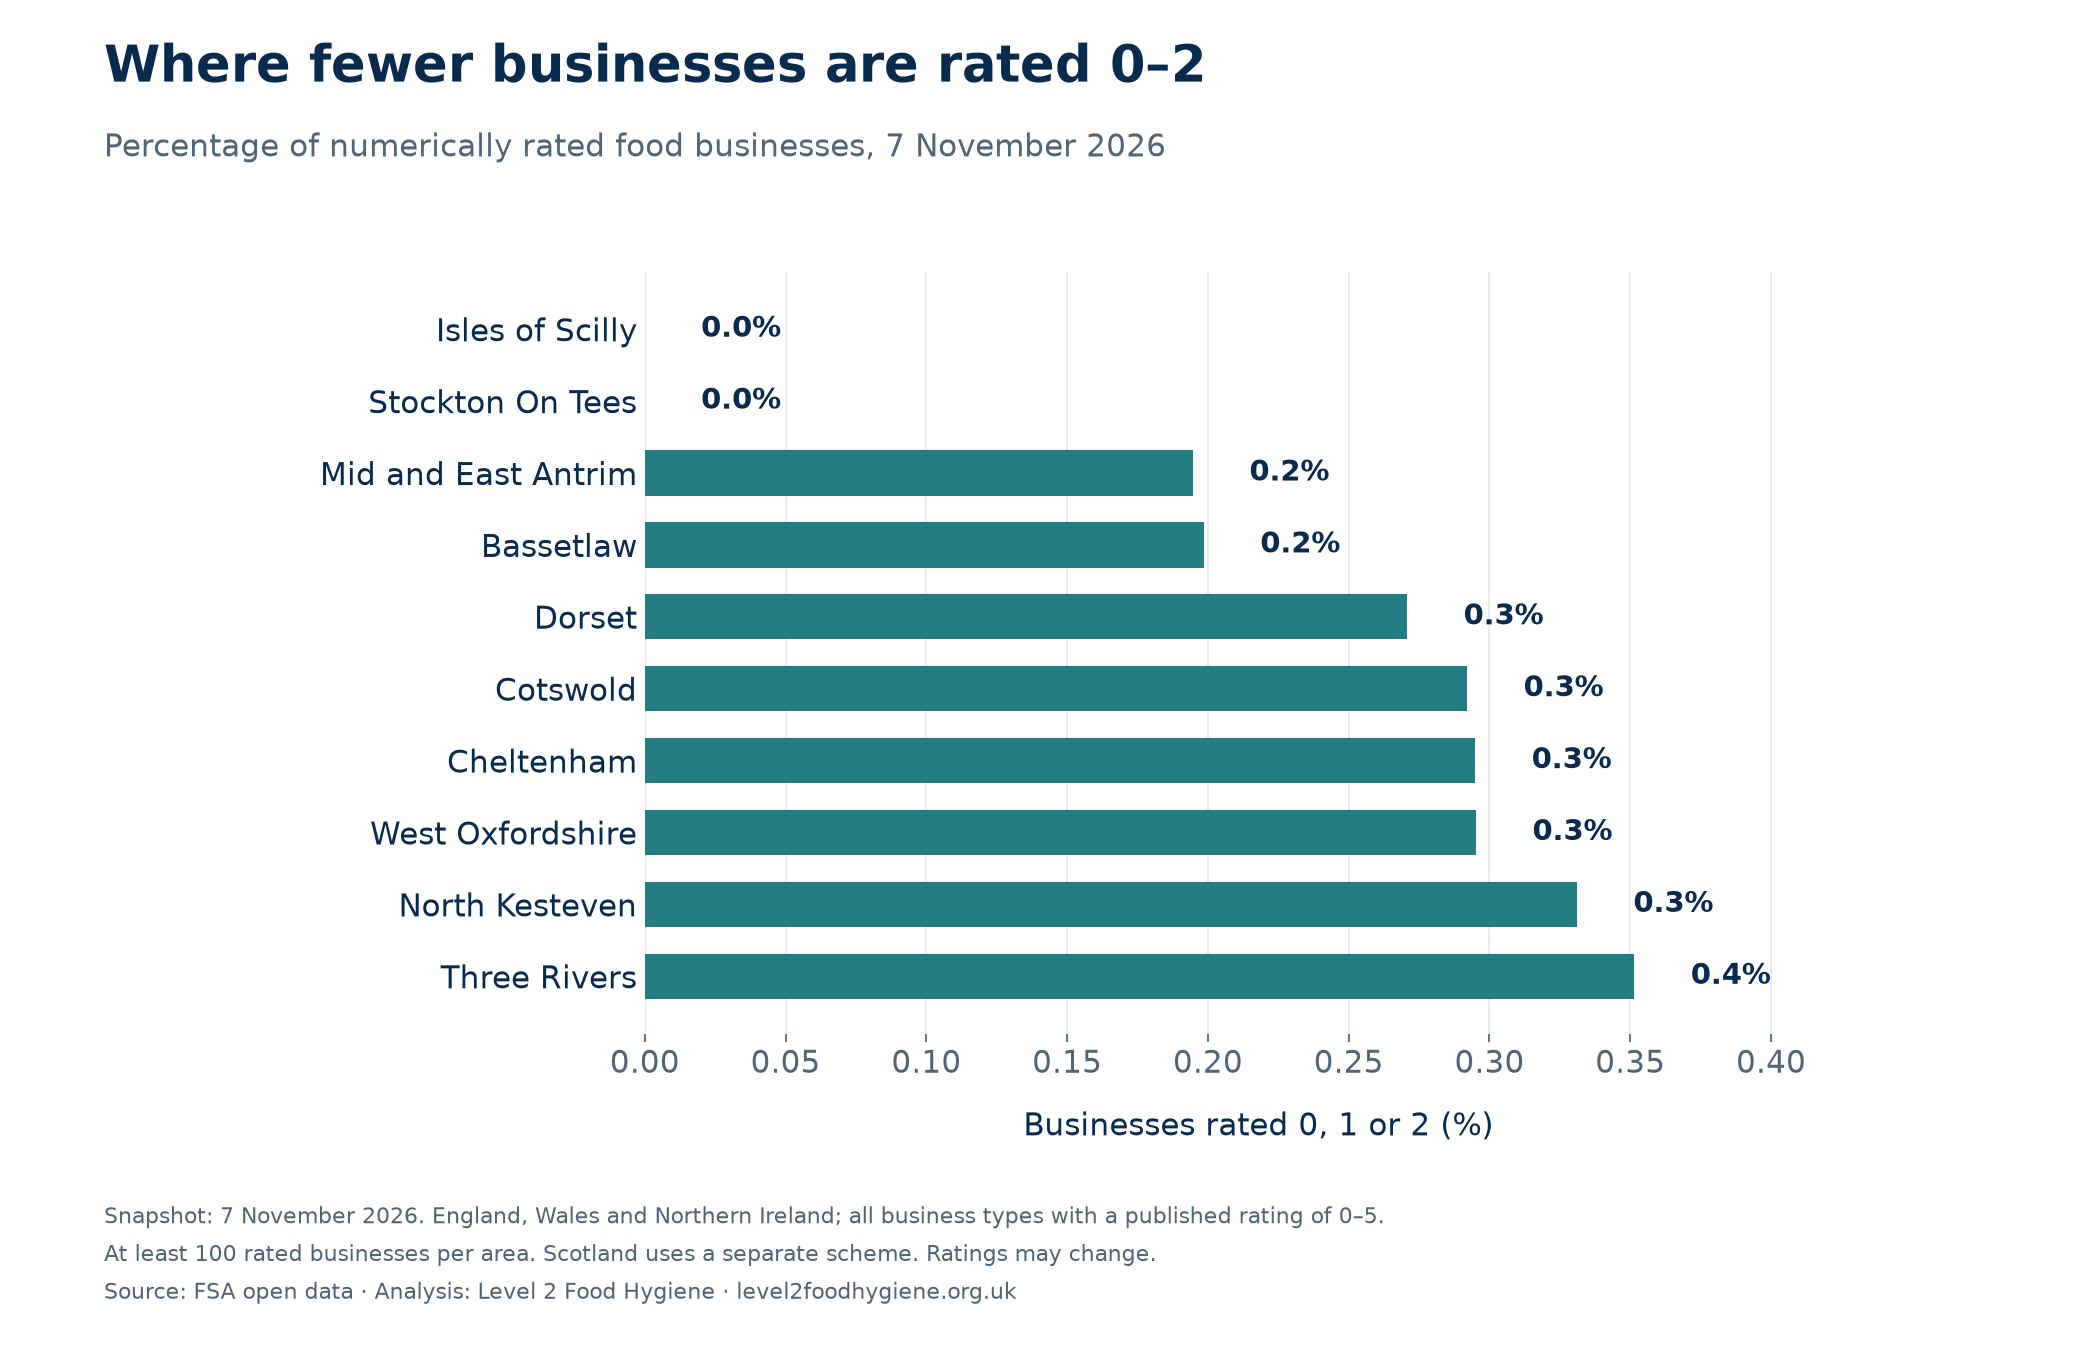
Stockton-on-Tees and the Isles of Scilly had no published ratings of 0–2 among 1,453 and 105 numerically rated businesses respectively. That is a snapshot result, not a guarantee about every business or future inspections.
Birmingham had the largest count of low-rated businesses, at 869, but ranked fifth by their share of rated businesses, at 10.23%. Showing the denominator makes it possible to distinguish a large food sector from a high proportion of low ratings.
The ten highest shares of ratings of 0–2
The ten lowest shares of ratings of 0–2
Bassetlaw leads on five-star ratings
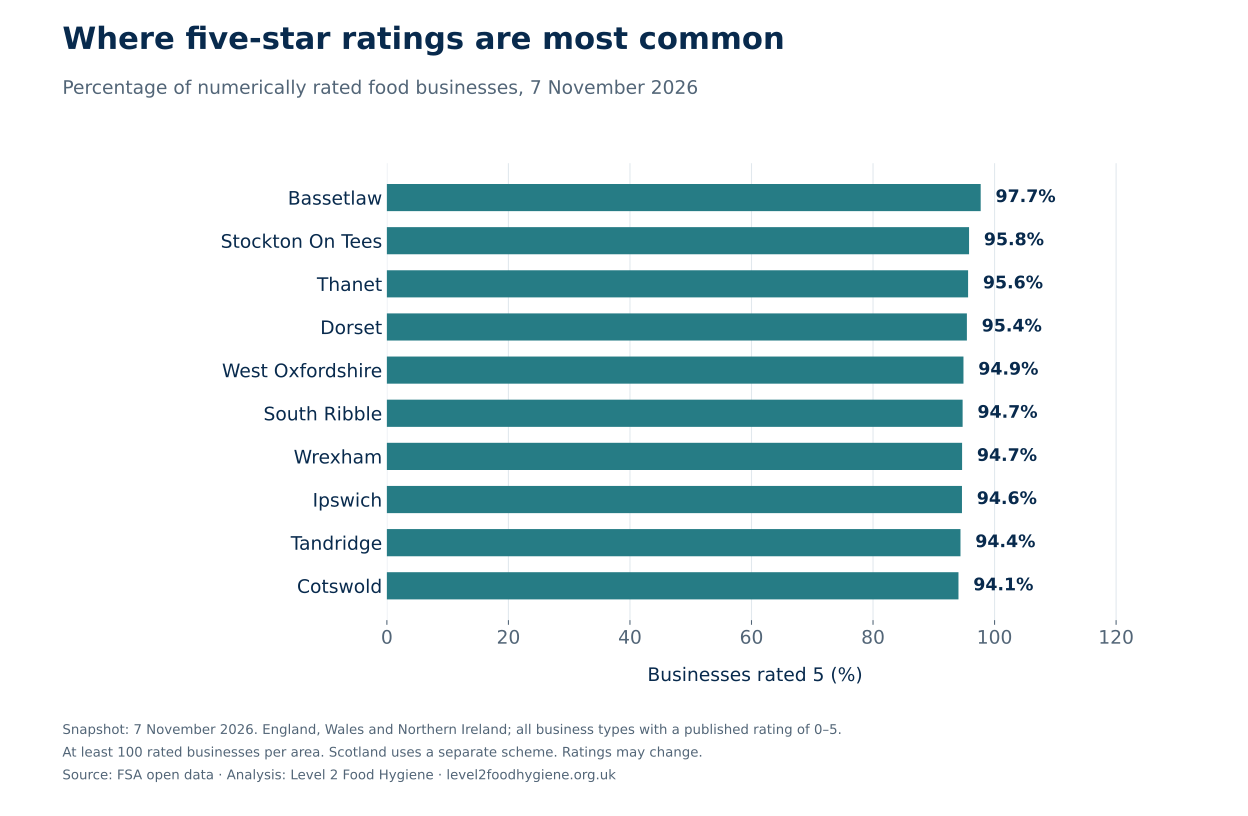
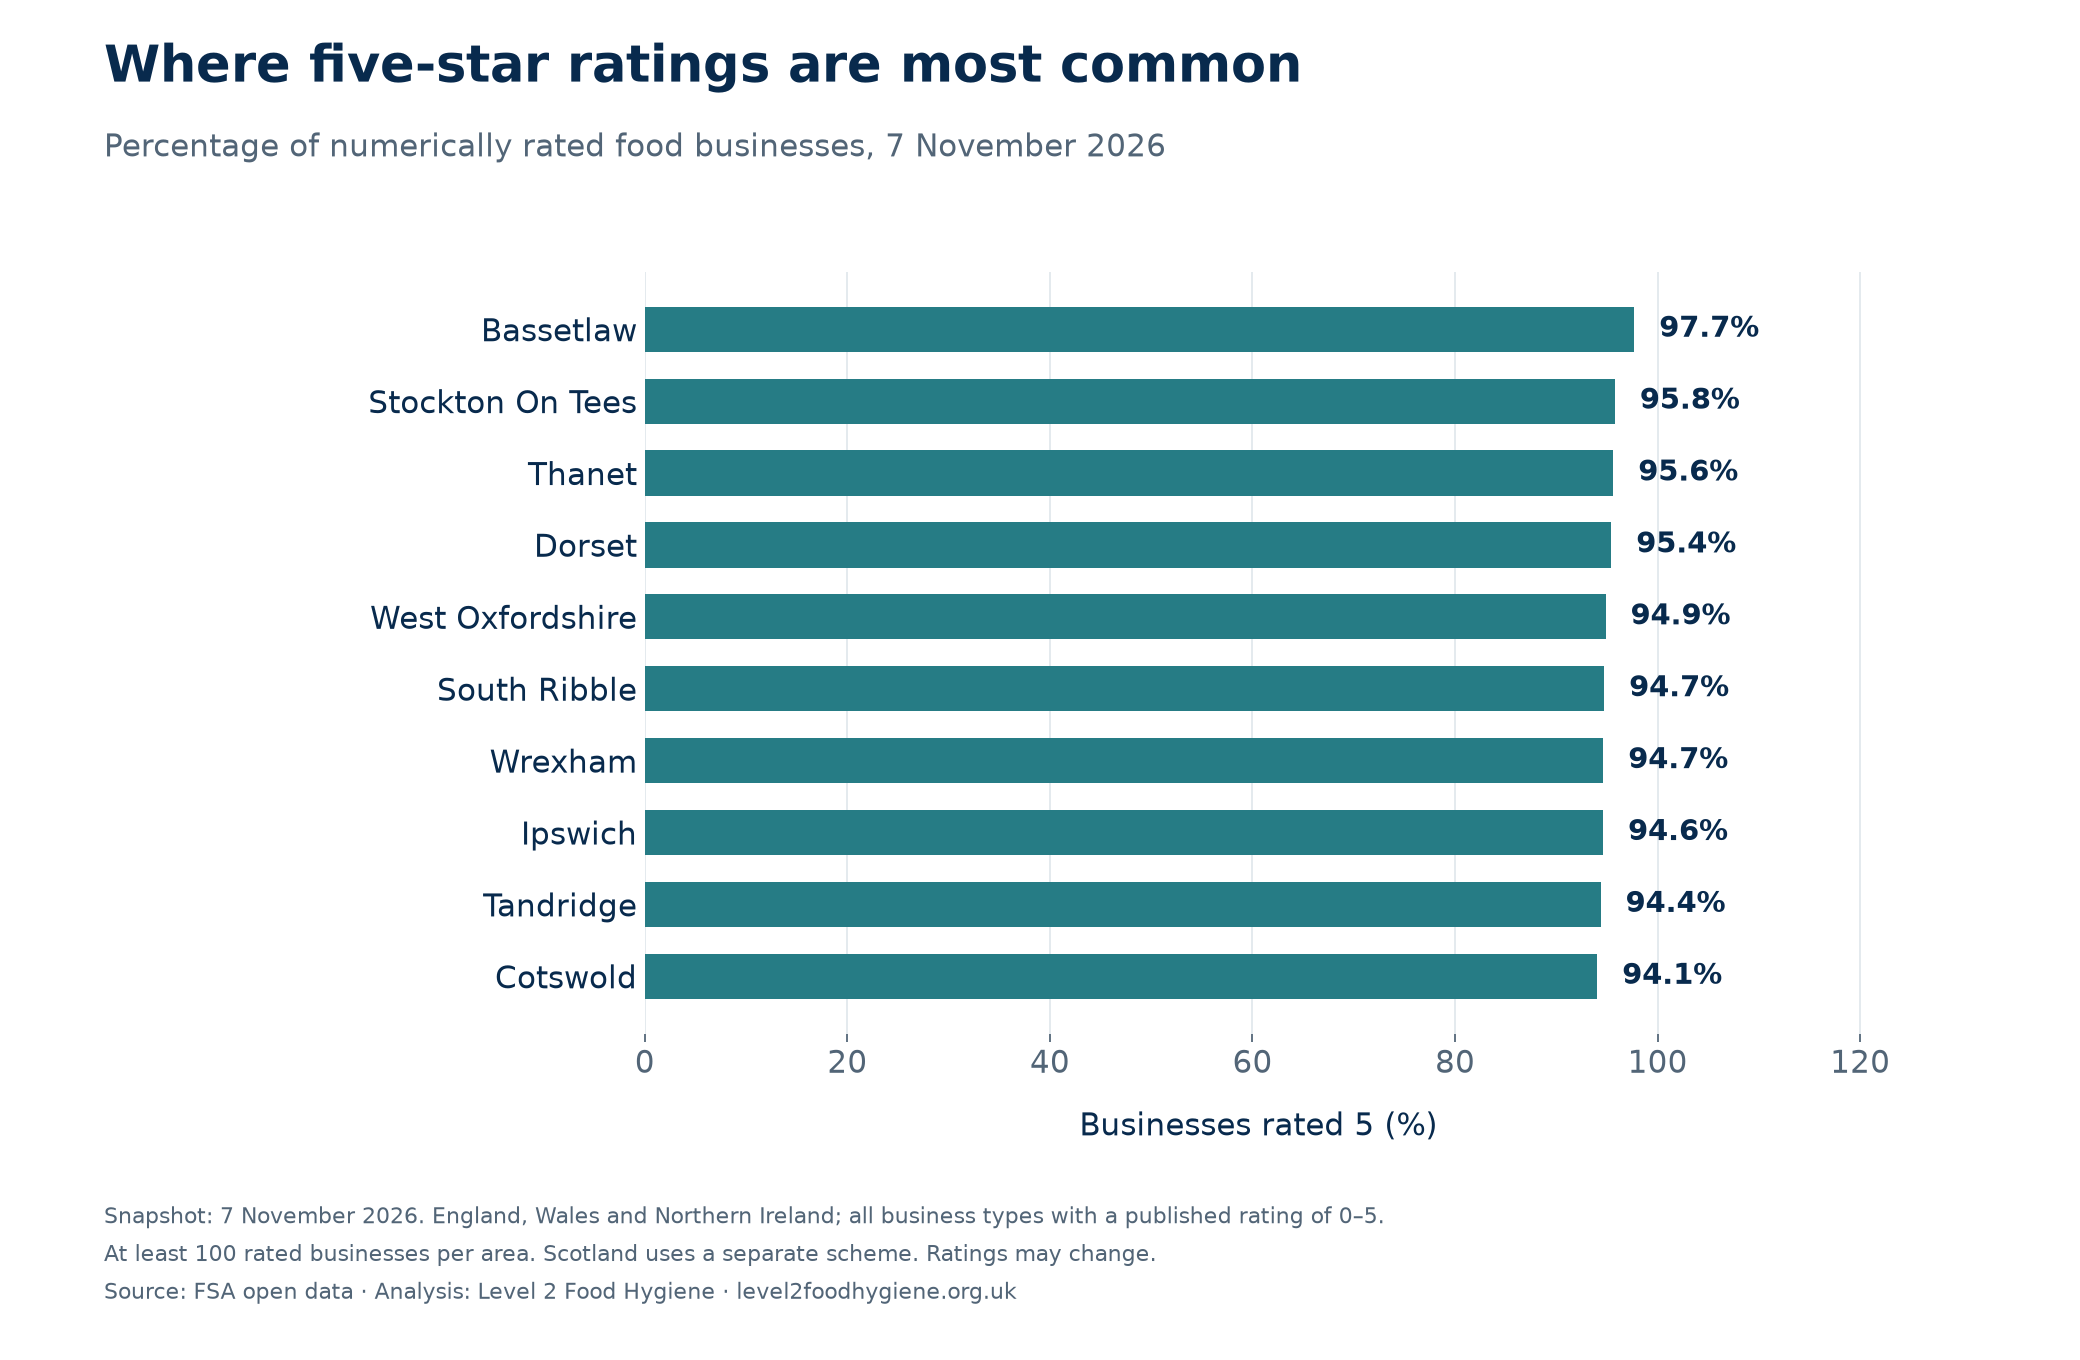
97.72% of Bassetlaw’s numerically rated businesses had a rating of 5: 984 out of 1,007. Stockton-on-Tees followed at 95.80% and Thanet at 95.64%. Across the three nations, 78.50% of numerically rated businesses held the top rating.
Business type changes the comparison
Takeaways and sandwich shops had a 5.70% share of ratings of 0–2, compared with 3.56% for restaurants, cafés and canteens. School, college and university premises had a share of 0.44%. An area’s mix of businesses can therefore affect its overall figure. Use the business-type filter to compare similar premises.
| Business type | Rated businesses | Rated 0–2 | Share rated 0–2 | Share rated 5 |
|---|---|---|---|---|
| Restaurant/Cafe/Canteen | 119,635 | 4,259 | 3.56% | 75.68% |
| Takeaway/sandwich shop | 52,151 | 2,970 | 5.70% | 61.49% |
| Pub/bar/nightclub | 43,950 | 1,001 | 2.28% | 77.20% |
| Hotel/bed & breakfast/guest house | 10,807 | 145 | 1.34% | 85.32% |
| School/college/university | 30,919 | 135 | 0.44% | 92.15% |
| Hospitals/Childcare/Caring Premises | 36,029 | 262 | 0.73% | 88.20% |
What a rating measures
Officers assess food handling, the condition of the premises and confidence in the business’s food safety management. A rating reflects the conditions assessed at that visit. It is not a food-quality score or a prediction of the chance of food poisoning. Source 3
Why a place may have more low ratings
Business mix, the timing of inspections, changes in operators and improvements awaiting a new published rating can all affect a snapshot. This dataset does not establish which of these explains a particular council’s position, or whether its inspection team performs better or worse.
How recent are the published ratings?
66,849 dated ratings were more than three years old across England, Wales and Northern Ireland: 13.66% of the 489,516 numerically rated records with a date. The local profiles show this measure alongside the hygiene figures.
A rating date is not a complete inspection history. Controls are risk-based and some visits may not produce a new rating. These figures cannot be used to count overdue inspections or businesses that have not been visited. Three rated records had no date and are excluded from this measure.
Scotland: highest and lowest shares requiring improvement
Scotland had 3,505 Improvement Required results among 46,365 published Pass, Pass and Eat Safe, or Improvement Required results: 7.56%. Shetland Islands had the highest share, at 17.03% (31 of 182); South Ayrshire had the lowest, at 0.91% (9 of 989). The different scheme means these percentages should not be compared directly with the 0–2 percentages above.
| Highest-share areas | Count / rated | Share | Lowest-share areas | Count / rated | Share |
|---|---|---|---|---|---|
| Shetland Islands | 31 / 182 | 17.03% | South Ayrshire | 9 / 989 | 0.91% |
| Aberdeen City | 302 / 1,792 | 16.85% | East Renfrewshire | 8 / 581 | 1.38% |
| Highland | 403 / 2,910 | 13.85% | Falkirk | 18 / 1,078 | 1.67% |
| Glasgow City | 611 / 4,596 | 13.29% | Renfrewshire | 23 / 1,367 | 1.68% |
| City of Edinburgh | 595 / 4,736 | 12.56% | Na h-Eileanan Siar | 12 / 522 | 2.30% |
| South Lanarkshire | 243 / 1,959 | 12.40% | Moray | 23 / 977 | 2.35% |
| Midlothian | 56 / 611 | 9.17% | Fife | 101 / 4,254 | 2.37% |
| Aberdeenshire | 174 / 2,167 | 8.03% | Perth and Kinross | 45 / 1,705 | 2.64% |
| Stirling | 87 / 1,084 | 8.03% | West Lothian | 27 / 923 | 2.93% |
| Clackmannanshire | 35 / 459 | 7.63% | East Dunbartonshire | 22 / 616 | 3.57% |
The FSA groups hospitals, childcare and caring premises together, and schools, colleges and universities together. These broad categories cannot support separate claims about hospital kitchens or primary schools.
Food hygiene ratings by business type and area
The overall council list combines very different businesses. These comparisons keep the FSA’s categories separate and require at least 100 numerically rated premises in each area and category. They cover England, Wales and Northern Ireland; Scotland remains a separate comparison in the explorer.
Takeaways and sandwich shops
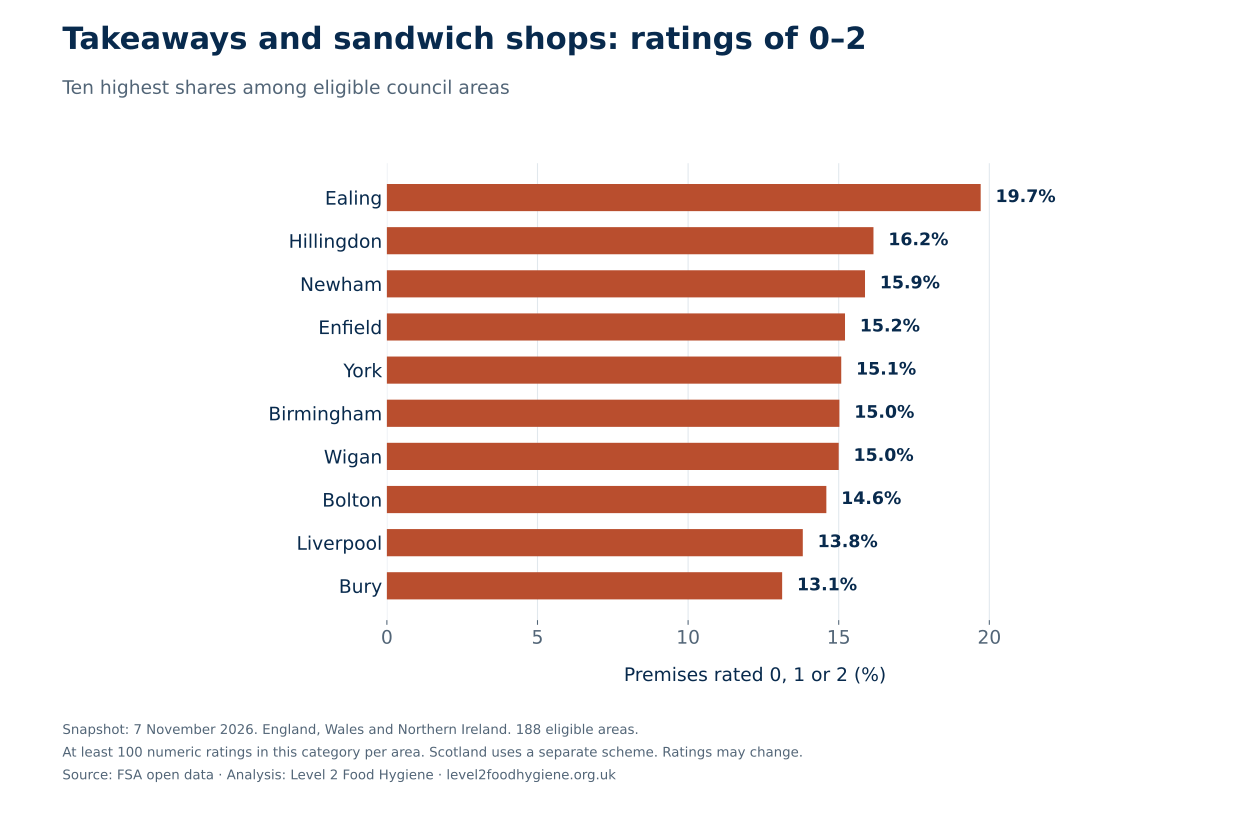
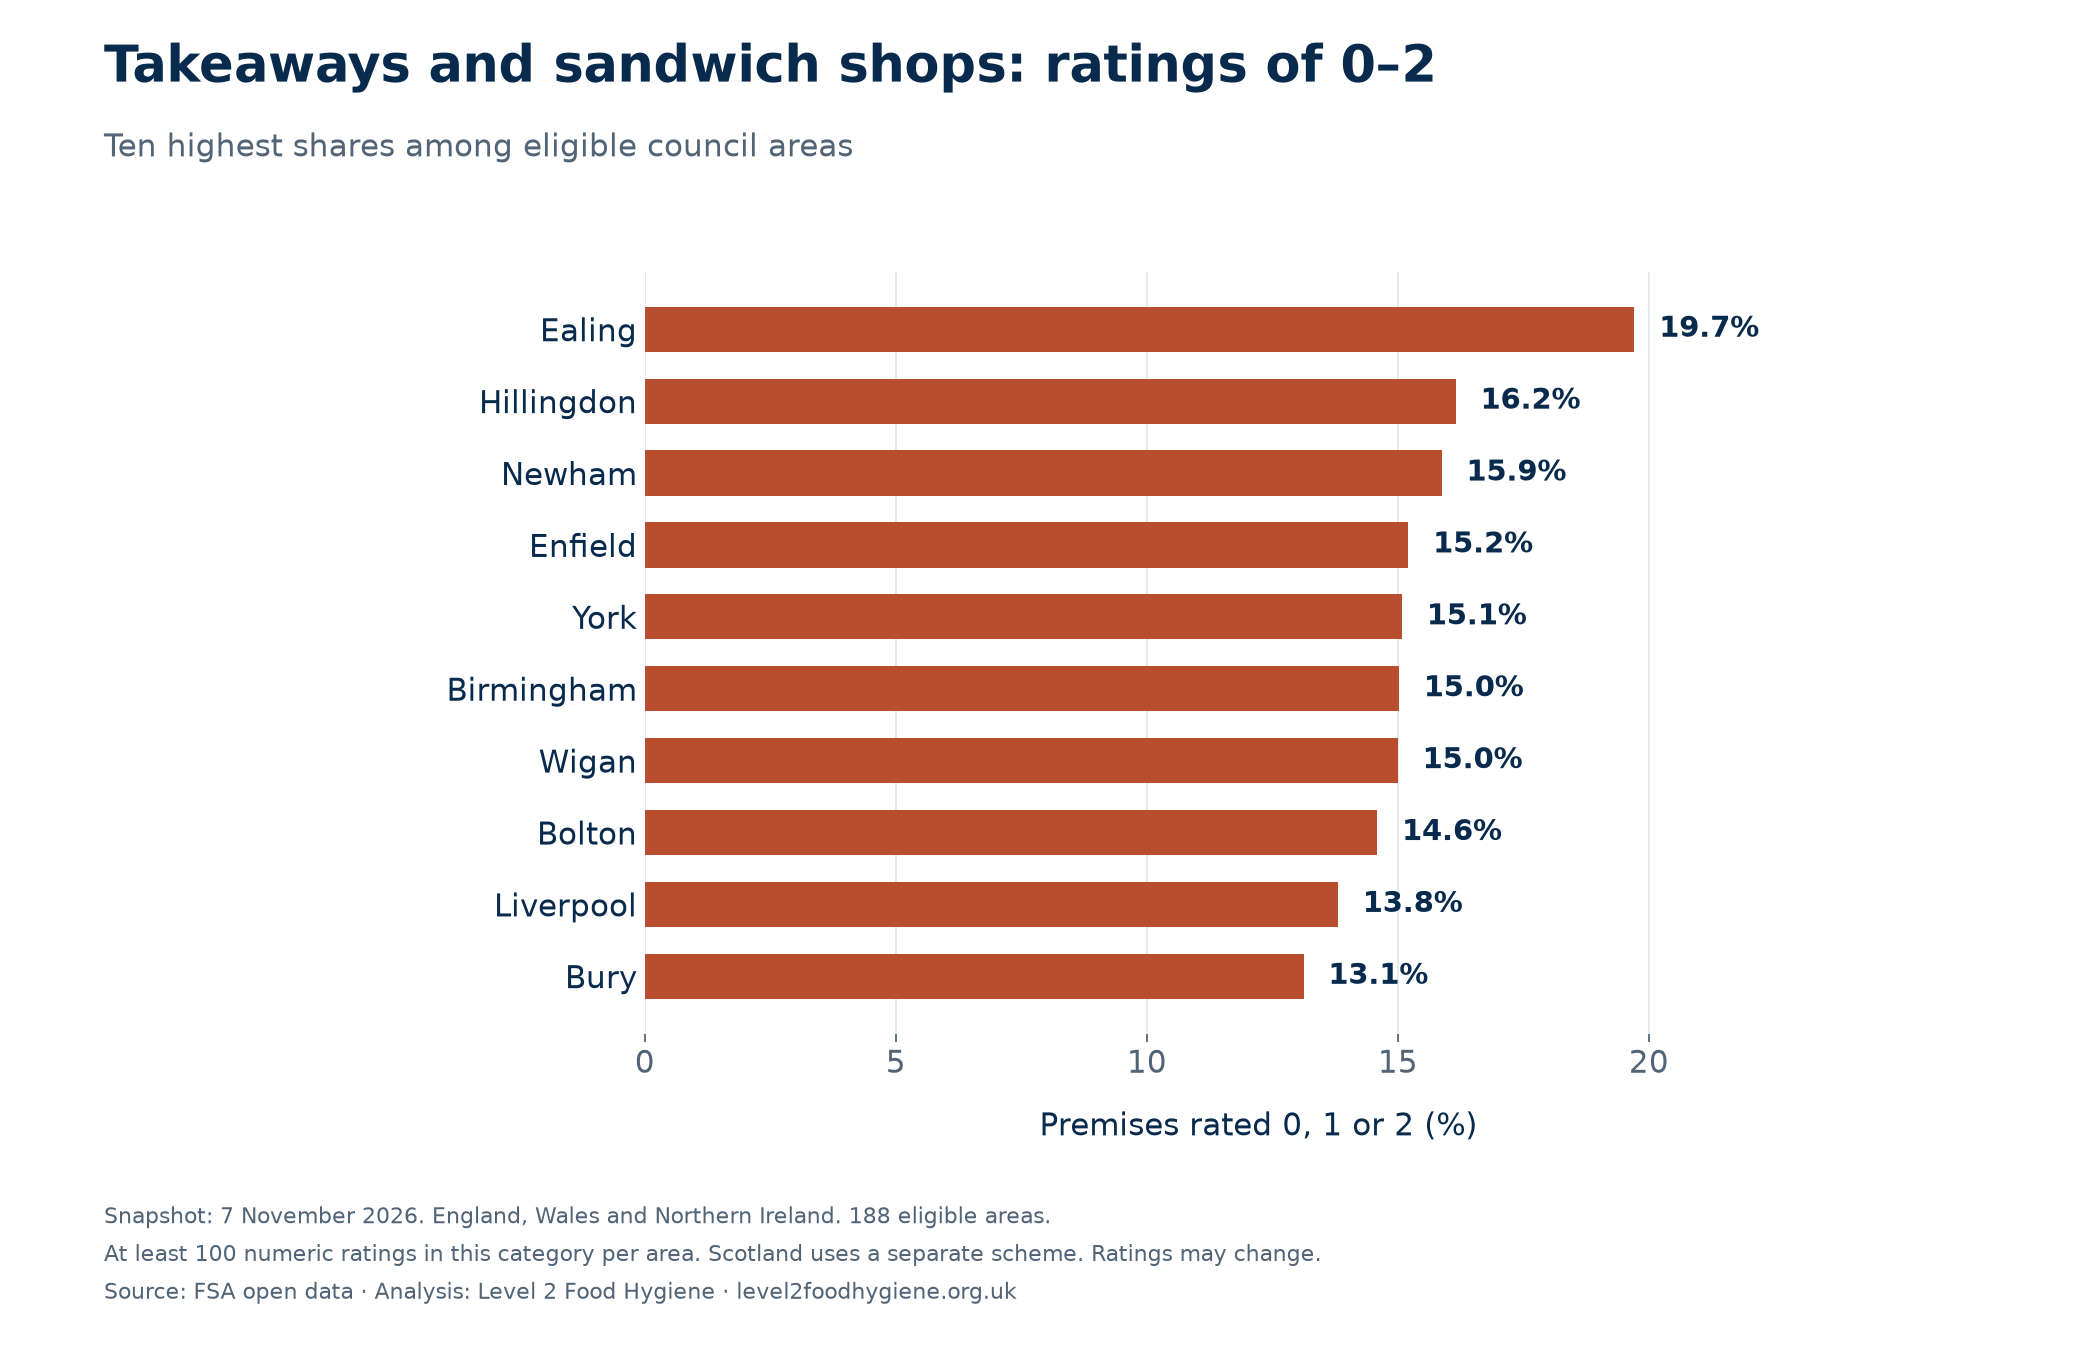
Almost one in five rated takeaways and sandwich shops in Ealing had a rating of 0–2: 55 of 279 (19.71%). Hillingdon followed at 16.15%, with Newham third at 15.87%. The three-nation category benchmark was 5.70%.
| Highest-share areas | 0–2 / rated | Share | Lowest-share areas | 0–2 / rated | Share |
|---|---|---|---|---|---|
| Ealing | 55 / 279 | 19.71% | Bassetlaw | 0 / 109 | 0.00% |
| Hillingdon | 42 / 260 | 16.15% | Colchester | 0 / 120 | 0.00% |
| Newham | 60 / 378 | 15.87% | Folkestone and Hythe | 0 / 103 | 0.00% |
| Enfield | 40 / 263 | 15.21% | Ipswich | 0 / 122 | 0.00% |
| York | 27 / 179 | 15.08% | Stockton On Tees | 0 / 176 | 0.00% |
Equal proportions share a rank. Where more than five areas tie at zero, alphabetical order determines which five appear here; the full download and explorer include every tied area. Counts and the snapshot date should accompany any reporting.
Restaurants, cafés and canteens
Ealing also led this category, with 170 of 908 premises rated 0–2 (18.72%). Birmingham followed at 13.29% and Newham at 11.66%. The three-nation category benchmark was 3.56%.
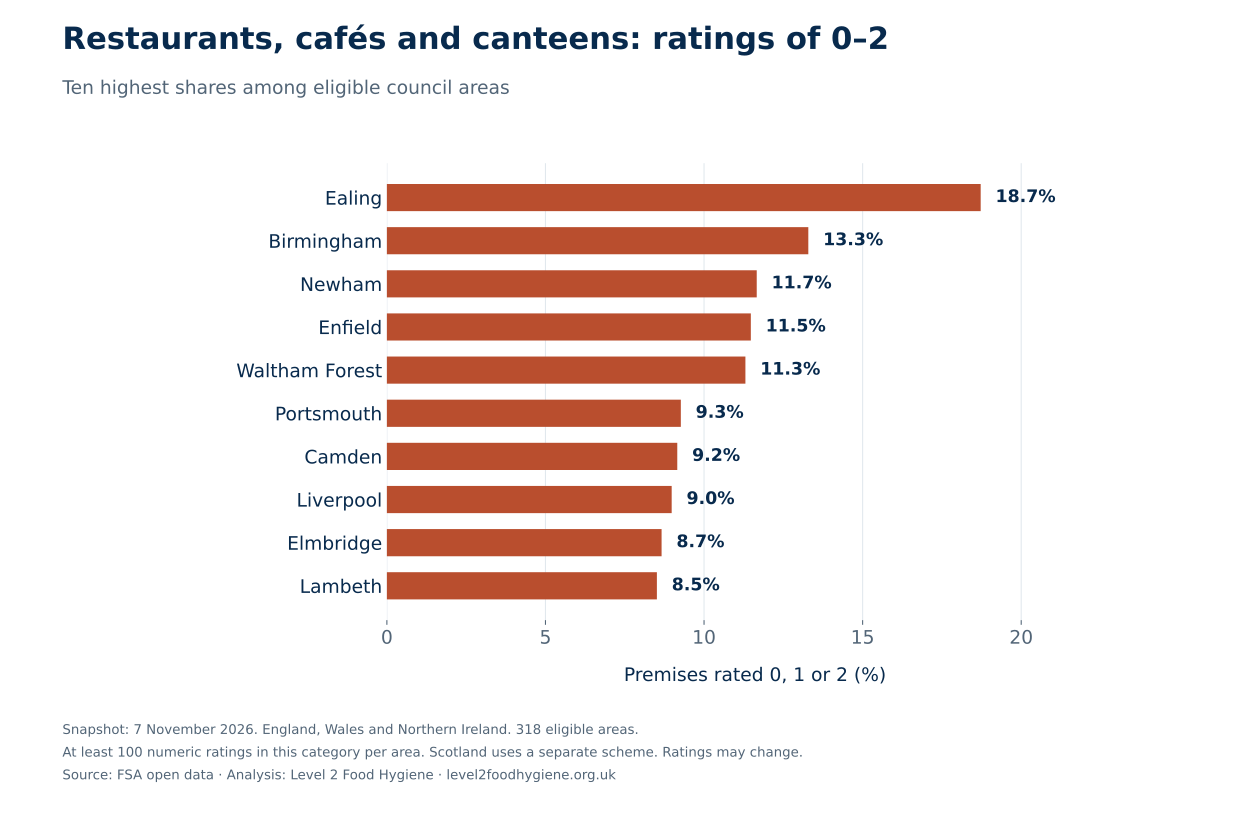
| Highest-share areas | 0–2 / rated | Share | Lowest-share areas | 0–2 / rated | Share |
|---|---|---|---|---|---|
| Ealing | 170 / 908 | 18.72% | Babergh | 0 / 145 | 0.00% |
| Birmingham | 291 / 2190 | 13.29% | Bassetlaw | 0 / 207 | 0.00% |
| Newham | 73 / 626 | 11.66% | Cannock Chase | 0 / 108 | 0.00% |
| Enfield | 63 / 549 | 11.48% | Castle Point | 0 / 100 | 0.00% |
| Waltham Forest | 65 / 575 | 11.30% | Dacorum | 0 / 241 | 0.00% |
Equal proportions share a rank. Where more than five areas tie at zero, alphabetical order determines which five appear here; the full download and explorer include every tied area. Counts and the snapshot date should accompany any reporting.
Pubs, bars and nightclubs
Hillingdon had the largest eligible low-rating share in this category: 12 of 121 (9.92%). Ealing followed at 9.15% and Caerphilly at 8.72%. The three-nation category benchmark was 2.28%.
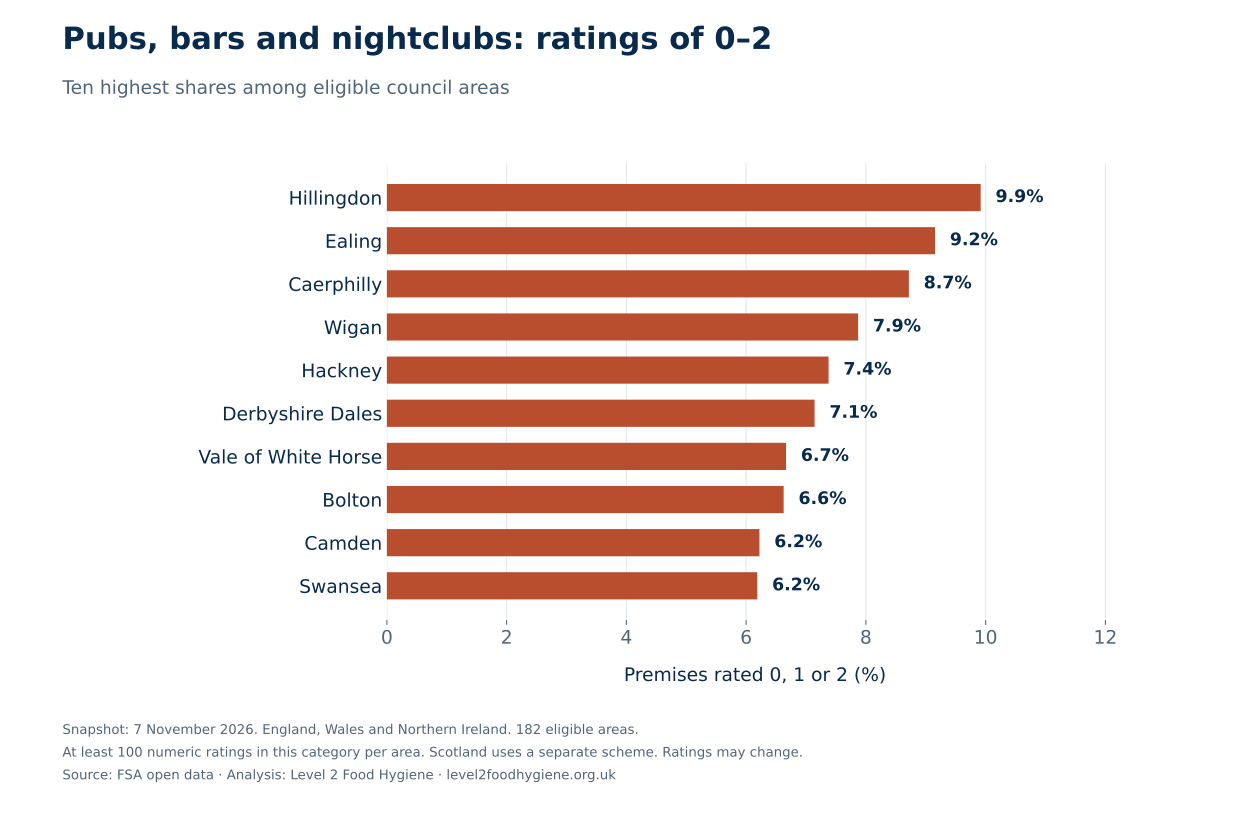
| Highest-share areas | 0–2 / rated | Share | Lowest-share areas | 0–2 / rated | Share |
|---|---|---|---|---|---|
| Hillingdon | 12 / 121 | 9.92% | Bassetlaw | 0 / 130 | 0.00% |
| Ealing | 13 / 142 | 9.15% | Bedford | 0 / 124 | 0.00% |
| Caerphilly | 17 / 195 | 8.72% | Carmarthenshire | 0 / 201 | 0.00% |
| Wigan | 17 / 216 | 7.87% | Chorley | 0 / 102 | 0.00% |
| Hackney | 9 / 122 | 7.38% | Cotswold | 0 / 128 | 0.00% |
Equal proportions share a rank. Where more than five areas tie at zero, alphabetical order determines which five appear here; the full download and explorer include every tied area. Counts and the snapshot date should accompany any reporting.
Does the mix of food businesses explain the rankings?
We applied the England, Wales and Northern Ireland low-rating share for each of the FSA’s 14 business categories to each council’s own mix of rated premises. That gives a comparison count: how many ratings of 0–2 would be expected if each local category matched its three-nation category average.
For Newham, that calculation gives 86.9 low ratings, compared with the 337 actually published: 3.88 times the comparison count. For Ealing, the comparison is 98.7 expected and 428 observed, or 4.34 times. Both remain well above their business-mix benchmark.
This is a descriptive comparison, not an explanation of cause. It adjusts only for the published business category. It does not adjust for business size, turnover, inspection timing, ownership, deprivation or other differences, and it cannot measure how well a council enforces food safety.
| Area | Published 0–2 | Expected from mix | Observed / expected | Raw-share rank |
|---|---|---|---|---|
| Newham | 337 | 86.9 | 3.88× | 1 |
| Ealing | 428 | 98.7 | 4.34× | 2 |
| Waltham Forest | 235 | 69.3 | 3.39× | 3 |
| Blackburn with Darwen | 122 | 39.4 | 3.10× | 4 |
| Birmingham | 869 | 267.4 | 3.25× | 5 |
| Enfield | 204 | 69.5 | 2.94× | 6 |
| Knowsley | 61 | 21.8 | 2.80× | 7 |
| Bolton | 191 | 78.7 | 2.43× | 8 |
| Portsmouth | 136 | 49.3 | 2.76× | 9 |
| Liverpool | 269 | 113.4 | 2.37× | 10 |
A ratio of 1 means the published count matches that area’s category-mix comparison; 2 means twice that count. Each area has a different business mixture, so these ratios are not used to rank areas against one another. They are not food-poisoning risks or percentages of businesses. Benchmarks include each area’s own records. See the standardisation guidance in the sources.
Download all 329 council comparisons and the 14 category benchmarks.
Explore the map and find your area
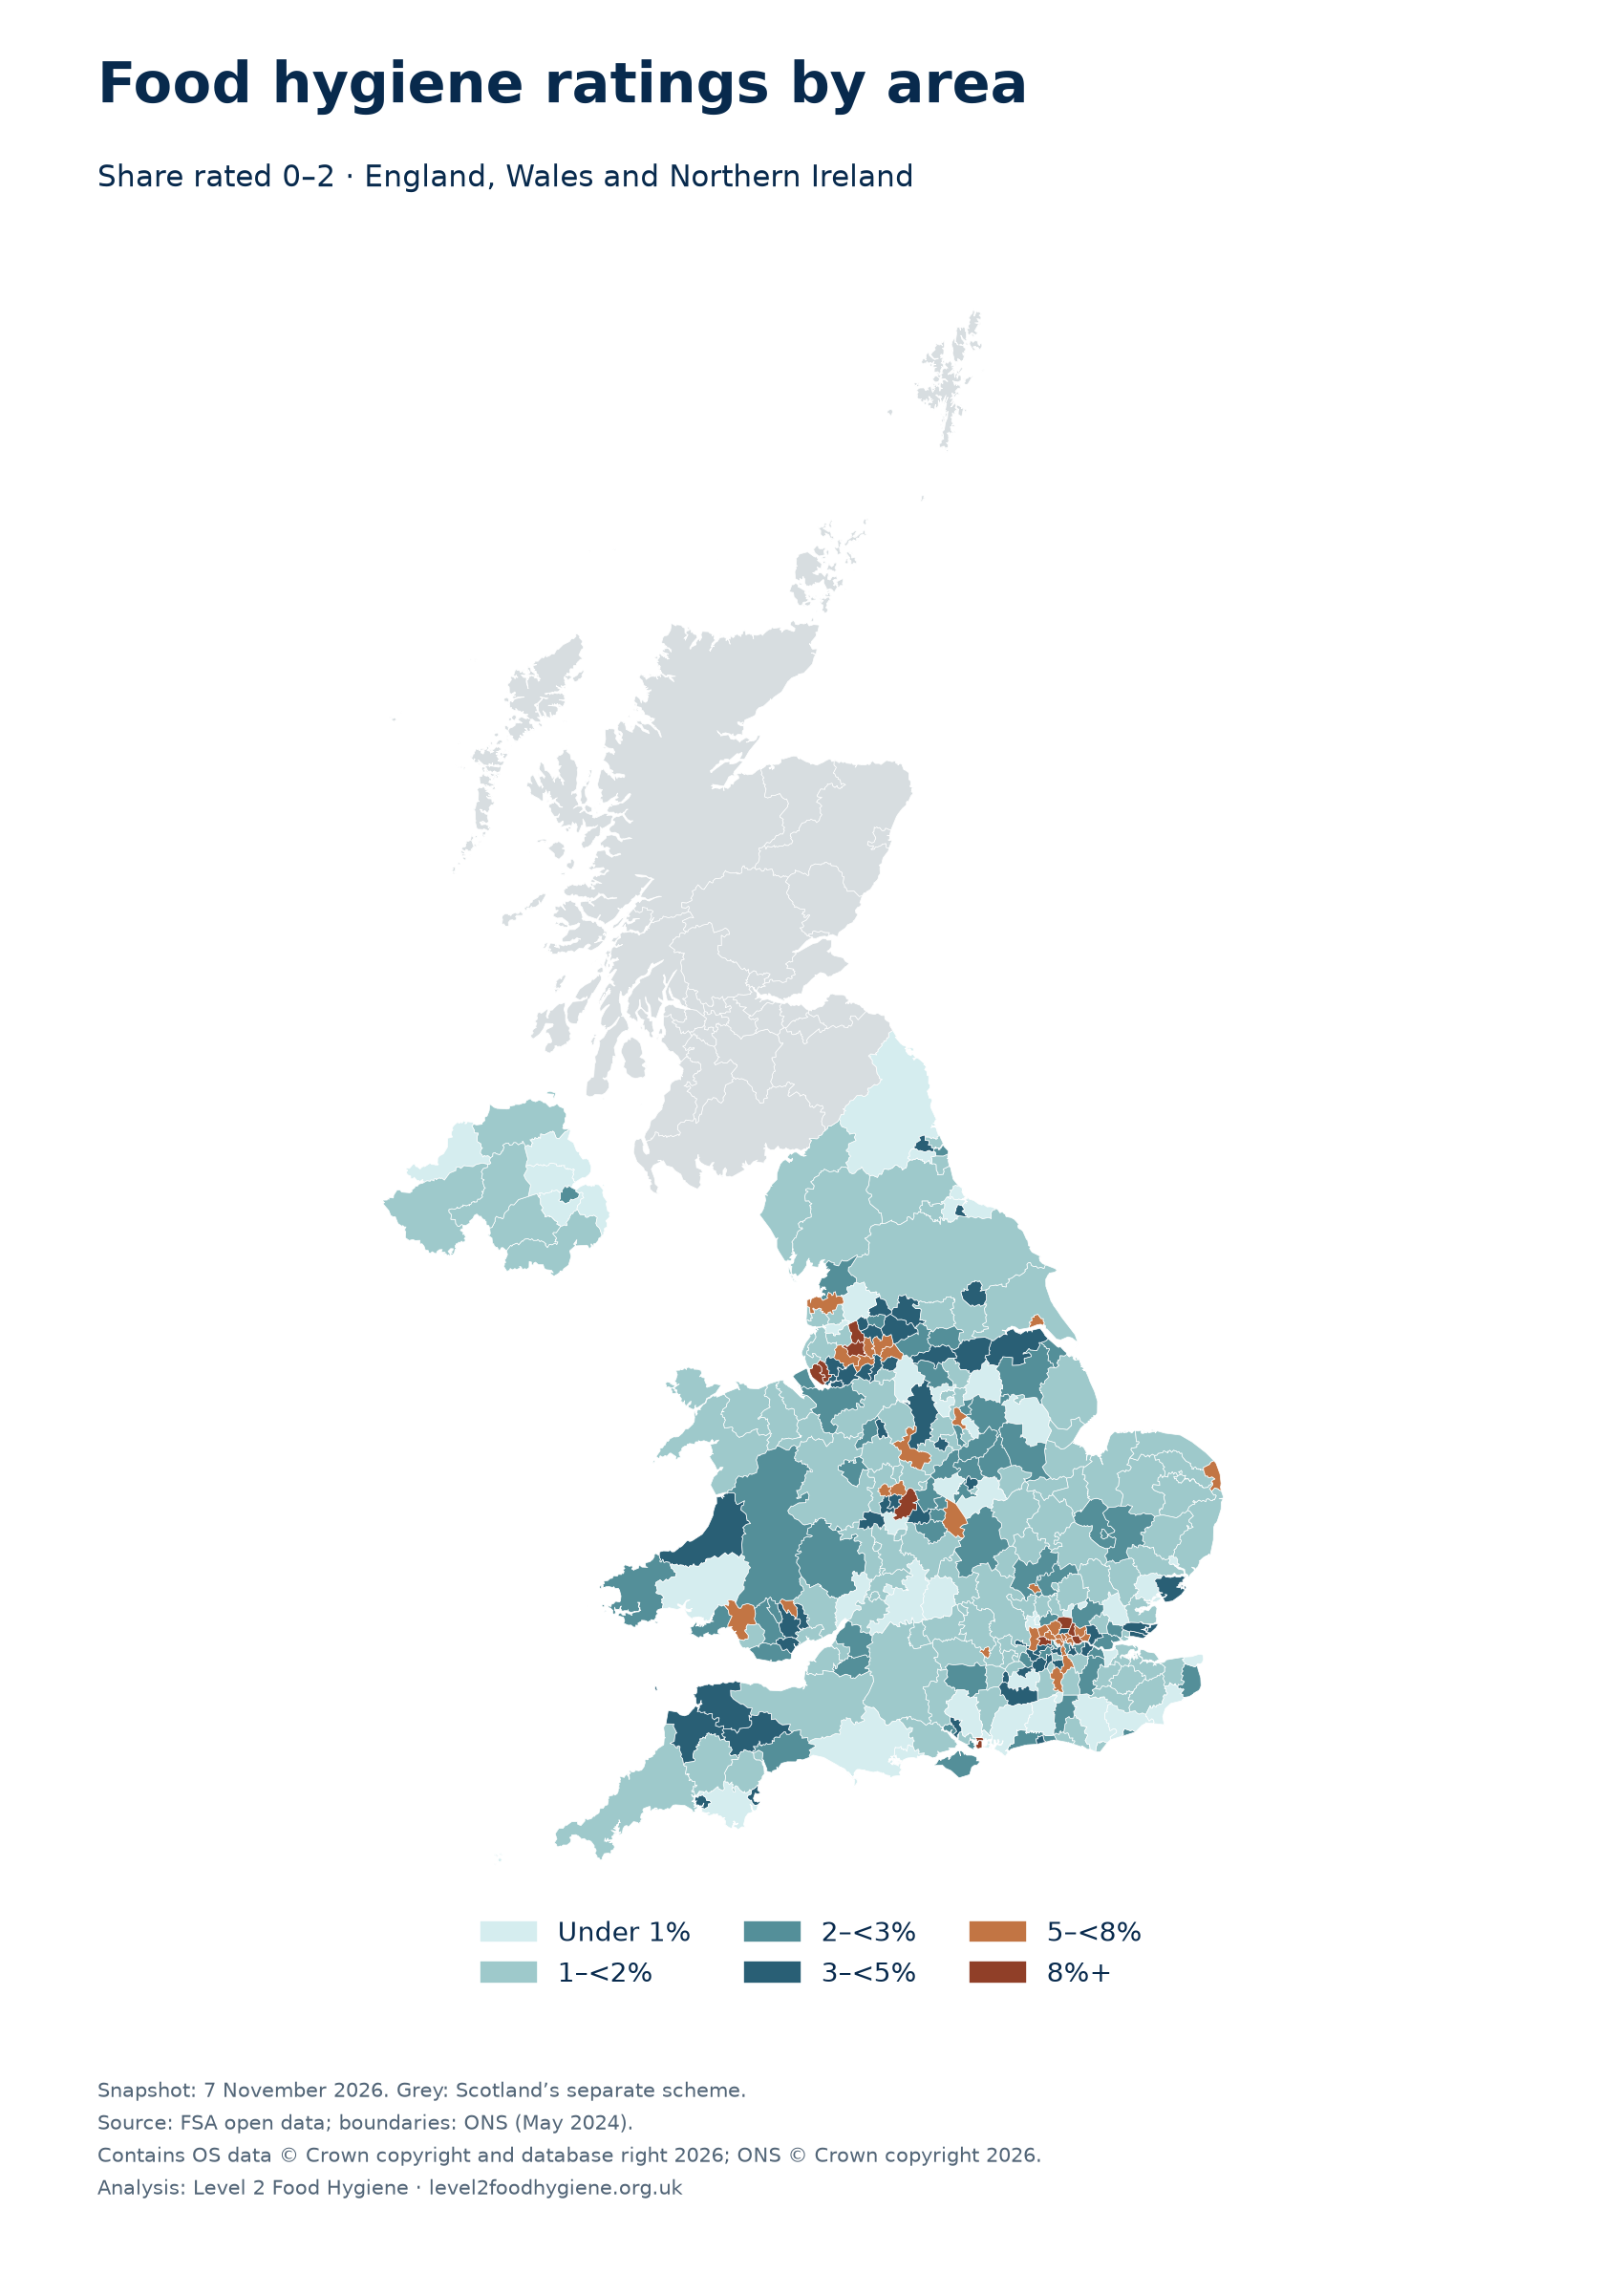
Select Scotland for its separate scheme. Grey means a different scheme or fewer than 100 rated businesses in the selected group. The snapshot is dated 7 November 2026; ratings can change.
Businesses rated 0–2 as a percentage of all numerically rated businesses
- Under 1%
- 1–<2%
- 2–<3%
- 3–<5%
- 5–<8%
- 8%+
- Not in this comparison
Boundaries: ONS, May 2024. Contains OS data © Crown copyright and database right 2026; ONS data © Crown copyright 2026. The table provides the same figures without using the map.
Download the 0–2 ratings map (PNG)
Compare two areas
Search the full table
329 council areas shown. Download the full CSV for every comparison.
| Area | Rated | Rated 0–2 | Share rated 0–2 | Share rated 5 | Other listed records |
|---|---|---|---|---|---|
| 2,457 | 337 | 13.72% | 48.64% | 213 | |
| 3,210 | 428 | 13.33% | 57.13% | 660 | |
| 1,860 | 235 | 12.63% | 50.59% | 112 | |
| 1,151 | 122 | 10.60% | 67.94% | 192 | |
| 8,496 | 869 | 10.23% | 64.18% | 1,731 | |
| 2,159 | 204 | 9.45% | 59.33% | 275 | |
| 699 | 61 | 8.73% | 66.38% | 137 | |
| 2,216 | 191 | 8.62% | 58.08% | 218 | |
| 1,578 | 136 | 8.62% | 63.12% | 217 | |
| 3,342 | 269 | 8.05% | 64.51% | 1,212 | |
| 1,243 | 99 | 7.96% | 56.23% | 227 | |
| 3,366 | 265 | 7.87% | 58.70% | 942 | |
| 2,348 | 184 | 7.84% | 54.17% | 253 | |
| 831 | 64 | 7.70% | 71.72% | 90 | |
| 1,997 | 152 | 7.61% | 63.55% | 249 | |
| 1,837 | 133 | 7.24% | 66.74% | 415 | |
| 1,521 | 110 | 7.23% | 74.10% | 370 | |
| 2,454 | 171 | 6.97% | 62.02% | 240 | |
| 5,328 | 354 | 6.64% | 70.48% | 468 | |
| 1,313 | 86 | 6.55% | 64.97% | 211 | |
| 1,029 | 64 | 6.22% | 70.75% | 77 | |
| 1,851 | 114 | 6.16% | 61.21% | 272 | |
| 2,876 | 177 | 6.15% | 70.79% | 324 | |
| 1,708 | 105 | 6.15% | 76.23% | 193 | |
| 888 | 54 | 6.08% | 63.74% | 142 | |
| 2,399 | 139 | 5.79% | 61.48% | 403 | |
| 2,082 | 120 | 5.76% | 70.32% | 215 | |
| 2,424 | 138 | 5.69% | 65.26% | 217 | |
| 1,571 | 86 | 5.47% | 62.19% | 340 | |
| 1,005 | 55 | 5.47% | 73.03% | 214 | |
| 863 | 47 | 5.45% | 79.49% | 124 | |
| 591 | 32 | 5.41% | 50.25% | 83 | |
| 2,043 | 110 | 5.38% | 74.99% | 139 | |
| 1,303 | 70 | 5.37% | 66.92% | 431 | |
| 1,153 | 61 | 5.29% | 67.56% | 62 | |
| 1,901 | 100 | 5.26% | 65.86% | 216 | |
| 1,087 | 57 | 5.24% | 72.59% | 157 | |
| 1,942 | 100 | 5.15% | 79.71% | 378 | |
| 2,879 | 148 | 5.14% | 64.36% | 249 | |
| 2,215 | 112 | 5.06% | 73.54% | 287 | |
| 876 | 44 | 5.02% | 72.03% | 243 | |
| 5,251 | 262 | 4.99% | 71.30% | 1,347 | |
| 2,589 | 129 | 4.98% | 73.77% | 206 | |
| 986 | 47 | 4.77% | 75.76% | 121 | |
| 2,553 | 120 | 4.70% | 76.30% | 178 | |
| 1,386 | 64 | 4.62% | 62.91% | 157 | |
| 888 | 41 | 4.62% | 61.04% | 155 | |
| 1,886 | 87 | 4.61% | 72.96% | 306 | |
| 609 | 27 | 4.43% | 79.47% | 73 | |
| 632 | 28 | 4.43% | 73.73% | 73 | |
| 2,350 | 102 | 4.34% | 67.53% | 427 | |
| 1,729 | 75 | 4.34% | 74.26% | 173 | |
| 824 | 35 | 4.25% | 64.81% | 94 | |
| 1,299 | 55 | 4.23% | 71.98% | 87 | |
| 1,752 | 74 | 4.22% | 72.32% | 275 | |
| 1,188 | 50 | 4.21% | 66.67% | 122 | |
| 577 | 24 | 4.16% | 83.19% | 79 | |
| 2,020 | 84 | 4.16% | 80.84% | 226 | |
| 2,155 | 89 | 4.13% | 61.72% | 569 | |
| 753 | 31 | 4.12% | 73.44% | 27 | |
| 1,271 | 51 | 4.01% | 79.62% | 155 | |
| 728 | 29 | 3.98% | 68.41% | 62 | |
| 1,193 | 47 | 3.94% | 79.72% | 319 | |
| 1,937 | 74 | 3.82% | 72.07% | 347 | |
| 1,642 | 61 | 3.71% | 77.22% | 170 | |
| 3,155 | 117 | 3.71% | 74.93% | 353 | |
| 1,571 | 58 | 3.69% | 76.26% | 158 | |
| 817 | 30 | 3.67% | 74.54% | 87 | |
| 1,281 | 47 | 3.67% | 73.22% | 163 | |
| 1,355 | 49 | 3.62% | 79.78% | 131 | |
| 1,636 | 59 | 3.61% | 71.45% | 163 | |
| 1,176 | 42 | 3.57% | 75.68% | 150 | |
| 4,124 | 146 | 3.54% | 72.45% | 571 | |
| 2,430 | 85 | 3.50% | 79.05% | 514 | |
| 951 | 33 | 3.47% | 80.13% | 78 | |
| 1,657 | 57 | 3.44% | 73.26% | 52 | |
| 2,040 | 70 | 3.43% | 64.22% | 425 | |
| 1,022 | 35 | 3.42% | 85.62% | 147 | |
| 1,625 | 55 | 3.38% | 82.34% | 251 | |
| 866 | 29 | 3.35% | 85.33% | 127 | |
| 727 | 24 | 3.30% | 71.11% | 72 | |
| 3,032 | 100 | 3.30% | 70.61% | 494 | |
| 968 | 31 | 3.20% | 74.59% | 119 | |
| 720 | 23 | 3.19% | 60.83% | 44 | |
| 1,389 | 44 | 3.17% | 71.56% | 104 | |
| 953 | 30 | 3.15% | 79.85% | 103 | |
| 1,845 | 58 | 3.14% | 77.89% | 105 | |
| 515 | 16 | 3.11% | 72.62% | 224 | |
| 684 | 21 | 3.07% | 85.09% | 88 | |
| 1,927 | 59 | 3.06% | 78.93% | 335 | |
| 687 | 21 | 3.06% | 85.44% | 69 | |
| 688 | 21 | 3.05% | 79.80% | 89 | |
| 1,348 | 41 | 3.04% | 83.53% | 142 | |
| 1,855 | 56 | 3.02% | 72.88% | 523 | |
| 3,639 | 109 | 3.00% | 73.84% | 208 | |
| 2,694 | 80 | 2.97% | 80.40% | 300 | |
| 943 | 28 | 2.97% | 77.94% | 142 | |
| 985 | 29 | 2.94% | 74.11% | 51 | |
| 1,258 | 37 | 2.94% | 81.40% | 110 | |
| 3,089 | 90 | 2.91% | 78.31% | 815 | |
| 2,213 | 64 | 2.89% | 73.20% | 107 | |
| 1,354 | 39 | 2.88% | 85.52% | 142 | |
| 1,853 | 53 | 2.86% | 67.67% | 160 | |
| 702 | 20 | 2.85% | 83.33% | 93 | |
| 1,197 | 34 | 2.84% | 80.87% | 214 | |
| 1,491 | 42 | 2.82% | 70.69% | 208 | |
| 2,290 | 64 | 2.79% | 75.02% | 290 | |
| 805 | 22 | 2.73% | 83.98% | 109 | |
| 1,283 | 35 | 2.73% | 83.32% | 399 | |
| 2,118 | 57 | 2.69% | 69.69% | 322 | |
| 1,491 | 40 | 2.68% | 69.48% | 215 | |
| 1,729 | 46 | 2.66% | 87.04% | 125 | |
| 2,113 | 56 | 2.65% | 79.32% | 243 | |
| 911 | 24 | 2.63% | 86.50% | 81 | |
| 534 | 14 | 2.62% | 58.61% | 52 | |
| 1,108 | 29 | 2.62% | 82.31% | 96 | |
| 705 | 18 | 2.55% | 84.26% | 188 | |
| 826 | 21 | 2.54% | 83.29% | 136 | |
| 633 | 16 | 2.53% | 80.09% | 47 | |
| 1,753 | 44 | 2.51% | 83.17% | 402 | |
| 567 | 14 | 2.47% | 86.24% | 37 | |
| 3,001 | 74 | 2.47% | 72.01% | 322 | |
| 736 | 18 | 2.45% | 75.82% | 82 | |
| 2,372 | 58 | 2.45% | 78.41% | 660 | |
| 1,146 | 28 | 2.44% | 71.99% | 201 | |
| 1,353 | 33 | 2.44% | 80.49% | 140 | |
| 1,845 | 45 | 2.44% | 77.56% | 170 | |
| 2,651 | 64 | 2.41% | 78.65% | 397 | |
| 746 | 18 | 2.41% | 80.29% | 96 | |
| 1,052 | 25 | 2.38% | 74.24% | 265 | |
| 806 | 19 | 2.36% | 70.60% | 63 | |
| 4,415 | 104 | 2.36% | 74.79% | 446 | |
| 1,320 | 31 | 2.35% | 84.17% | 215 | |
| 427 | 10 | 2.34% | 90.16% | 34 | |
| 1,073 | 25 | 2.33% | 85.74% | 78 | |
| 475 | 11 | 2.32% | 84.42% | 75 | |
| 2,908 | 67 | 2.30% | 72.73% | 282 | |
| 608 | 14 | 2.30% | 81.91% | 115 | |
| 1,185 | 27 | 2.28% | 72.91% | 166 | |
| 1,101 | 25 | 2.27% | 78.56% | 94 | |
| 1,410 | 32 | 2.27% | 74.54% | 203 | |
| 1,016 | 23 | 2.26% | 79.23% | 121 | |
| 1,215 | 27 | 2.22% | 84.03% | 118 | |
| 1,309 | 29 | 2.22% | 79.07% | 166 | |
| 1,421 | 31 | 2.18% | 89.80% | 61 | |
| 832 | 18 | 2.16% | 87.50% | 101 | |
| 1,879 | 40 | 2.13% | 79.24% | 319 | |
| 857 | 18 | 2.10% | 91.02% | 52 | |
| 1,578 | 33 | 2.09% | 77.57% | 205 | |
| 1,247 | 26 | 2.09% | 89.66% | 162 | |
| 1,735 | 36 | 2.07% | 73.37% | 106 | |
| 921 | 19 | 2.06% | 84.69% | 156 | |
| 876 | 18 | 2.05% | 80.82% | 90 | |
| 1,127 | 23 | 2.04% | 83.58% | 80 | |
| 1,529 | 31 | 2.03% | 75.80% | 192 | |
| 592 | 12 | 2.03% | 83.11% | 80 | |
| 839 | 17 | 2.03% | 86.05% | 80 | |
| 2,138 | 42 | 1.96% | 81.43% | 587 | |
| 1,429 | 28 | 1.96% | 87.19% | 64 | |
| 512 | 10 | 1.95% | 80.27% | 222 | |
| 2,832 | 55 | 1.94% | 85.38% | 250 | |
| 1,566 | 30 | 1.92% | 76.37% | 157 | |
| 785 | 15 | 1.91% | 72.61% | 122 | |
| 1,680 | 32 | 1.90% | 79.58% | 7 | |
| 368 | 7 | 1.90% | 75.00% | 126 | |
| 3,000 | 57 | 1.90% | 81.70% | 1,278 | |
| 1,323 | 25 | 1.89% | 82.99% | 272 | |
| 1,059 | 20 | 1.89% | 77.15% | 116 | |
| 1,921 | 36 | 1.87% | 83.97% | 359 | |
| 697 | 13 | 1.87% | 85.65% | 52 | |
| 1,456 | 27 | 1.85% | 82.14% | 163 | |
| 1,349 | 25 | 1.85% | 87.03% | 162 | |
| 4,124 | 76 | 1.84% | 74.44% | 530 | |
| 2,284 | 42 | 1.84% | 85.07% | 206 | |
| 1,143 | 21 | 1.84% | 78.48% | 243 | |
| 984 | 18 | 1.83% | 79.47% | 87 | |
| 6,291 | 115 | 1.83% | 86.06% | 821 | |
| 986 | 18 | 1.83% | 82.15% | 74 | |
| 879 | 16 | 1.82% | 87.14% | 93 | |
| 948 | 17 | 1.79% | 85.55% | 94 | |
| 1,228 | 22 | 1.79% | 81.03% | 115 | |
| 4,078 | 73 | 1.79% | 81.36% | 518 | |
| 783 | 14 | 1.79% | 81.86% | 316 | |
| 1,008 | 18 | 1.79% | 84.82% | 93 | |
| 1,366 | 24 | 1.76% | 66.47% | 235 | |
| 1,440 | 25 | 1.74% | 81.11% | 162 | |
| 693 | 12 | 1.73% | 85.71% | 57 | |
| 2,138 | 37 | 1.73% | 83.96% | 264 | |
| 1,229 | 21 | 1.71% | 87.39% | 103 | |
| 1,172 | 20 | 1.71% | 72.70% | 115 | |
| 762 | 13 | 1.71% | 85.70% | 130 | |
| 767 | 13 | 1.69% | 84.35% | 83 | |
| 2,660 | 45 | 1.69% | 89.92% | 398 | |
| 595 | 10 | 1.68% | 78.32% | 97 | |
| 1,435 | 24 | 1.67% | 83.97% | 224 | |
| 2,343 | 39 | 1.66% | 77.93% | 198 | |
| 603 | 10 | 1.66% | 92.04% | 42 | |
| 609 | 10 | 1.64% | 78.00% | 220 | |
| 1,000 | 16 | 1.60% | 81.60% | 128 | |
| 3,753 | 60 | 1.60% | 76.34% | 719 | |
| 755 | 12 | 1.59% | 86.62% | 116 | |
| 884 | 14 | 1.58% | 86.88% | 118 | |
| 1,281 | 20 | 1.56% | 82.36% | 322 | |
| 1,474 | 23 | 1.56% | 77.95% | 193 | |
| 963 | 15 | 1.56% | 78.61% | 159 | |
| 5,592 | 87 | 1.56% | 75.29% | 2,047 | |
| 1,158 | 18 | 1.55% | 90.41% | 145 | |
| 1,030 | 16 | 1.55% | 82.14% | 44 | |
| 1,354 | 21 | 1.55% | 88.85% | 163 | |
| 2,004 | 31 | 1.55% | 88.42% | 207 | |
| 920 | 14 | 1.52% | 88.48% | 38 | |
| 724 | 11 | 1.52% | 87.29% | 92 | |
| 2,179 | 33 | 1.51% | 76.69% | 315 | |
| 1,203 | 18 | 1.50% | 84.54% | 39 | |
| 1,405 | 21 | 1.49% | 72.10% | 145 | |
| 1,405 | 21 | 1.49% | 83.70% | 64 | |
| 1,484 | 22 | 1.48% | 79.51% | 172 | |
| 1,967 | 29 | 1.47% | 80.58% | 188 | |
| 1,225 | 18 | 1.47% | 72.73% | 138 | |
| 548 | 8 | 1.46% | 86.31% | 74 | |
| 414 | 6 | 1.45% | 86.71% | 50 | |
| 1,175 | 17 | 1.45% | 84.94% | 110 | |
| 830 | 12 | 1.45% | 90.48% | 87 | |
| 692 | 10 | 1.45% | 93.79% | 46 | |
| 970 | 14 | 1.44% | 81.55% | 96 | |
| 1,599 | 23 | 1.44% | 88.56% | 137 | |
| 980 | 14 | 1.43% | 88.06% | 75 | |
| 701 | 10 | 1.43% | 82.74% | 106 | |
| 1,054 | 15 | 1.42% | 81.02% | 72 | |
| 773 | 11 | 1.42% | 90.56% | 2 | |
| 494 | 7 | 1.42% | 90.49% | 192 | |
| 992 | 14 | 1.41% | 78.63% | 112 | |
| 853 | 12 | 1.41% | 85.58% | 107 | |
| 1,353 | 19 | 1.40% | 87.66% | 123 | |
| 501 | 7 | 1.40% | 86.63% | 67 | |
| 5,349 | 74 | 1.38% | 84.37% | 63 | |
| 1,103 | 15 | 1.36% | 85.58% | 188 | |
| 1,183 | 16 | 1.35% | 87.24% | 97 | |
| 1,332 | 18 | 1.35% | 85.36% | 114 | |
| 445 | 6 | 1.35% | 77.08% | 122 | |
| 1,444 | 19 | 1.32% | 86.36% | 34 | |
| 1,155 | 15 | 1.30% | 83.64% | 277 | |
| 771 | 10 | 1.30% | 86.25% | 38 | |
| 2,794 | 36 | 1.29% | 83.32% | 194 | |
| 624 | 8 | 1.28% | 94.39% | 79 | |
| 2,914 | 37 | 1.27% | 88.02% | 230 | |
| 1,976 | 25 | 1.27% | 90.28% | 140 | |
| 2,299 | 29 | 1.26% | 88.78% | 110 | |
| 1,271 | 16 | 1.26% | 86.47% | 124 | |
| 1,034 | 13 | 1.26% | 83.75% | 46 | |
| 724 | 9 | 1.24% | 86.74% | 85 | |
| 805 | 10 | 1.24% | 85.71% | 67 | |
| 809 | 10 | 1.24% | 87.52% | 70 | |
| 1,299 | 16 | 1.23% | 89.07% | 88 | |
| 491 | 6 | 1.22% | 92.46% | 47 | |
| 991 | 12 | 1.21% | 84.96% | 112 | |
| 827 | 10 | 1.21% | 79.44% | 117 | |
| 3,006 | 36 | 1.20% | 84.86% | 205 | |
| 1,170 | 14 | 1.20% | 89.40% | 122 | |
| 1,007 | 12 | 1.19% | 87.59% | 100 | |
| 336 | 4 | 1.19% | 82.44% | 74 | |
| 2,773 | 33 | 1.19% | 87.49% | 355 | |
| 1,016 | 12 | 1.18% | 93.31% | 98 | |
| 1,784 | 21 | 1.18% | 89.29% | 242 | |
| 681 | 8 | 1.17% | 92.66% | 55 | |
| 2,558 | 30 | 1.17% | 84.21% | 294 | |
| 692 | 8 | 1.16% | 82.95% | 76 | |
| 954 | 11 | 1.15% | 79.45% | 132 | |
| 5,544 | 63 | 1.14% | 87.39% | 621 | |
| 1,147 | 13 | 1.13% | 78.64% | 128 | |
| 1,239 | 14 | 1.13% | 86.68% | 78 | |
| 724 | 8 | 1.10% | 86.33% | 98 | |
| 1,478 | 16 | 1.08% | 83.83% | 134 | |
| 653 | 7 | 1.07% | 89.43% | 195 | |
| 2,825 | 30 | 1.06% | 89.35% | 298 | |
| 661 | 7 | 1.06% | 78.06% | 113 | |
| 567 | 6 | 1.06% | 84.30% | 73 | |
| 858 | 9 | 1.05% | 88.69% | 86 | |
| 1,750 | 18 | 1.03% | 83.94% | 142 | |
| 1,179 | 12 | 1.02% | 94.66% | 37 | |
| 593 | 6 | 1.01% | 89.38% | 85 | |
| 703 | 7 | 1.00% | 89.76% | 56 | |
| 1,012 | 10 | 0.99% | 80.73% | 148 | |
| 1,454 | 14 | 0.96% | 92.02% | 167 | |
| 2,958 | 28 | 0.95% | 88.47% | 645 | |
| 742 | 7 | 0.94% | 94.74% | 107 | |
| 863 | 8 | 0.93% | 81.69% | 143 | |
| 1,826 | 16 | 0.88% | 87.73% | 184 | |
| 711 | 6 | 0.84% | 92.55% | 112 | |
| 596 | 5 | 0.84% | 89.09% | 58 | |
| 841 | 7 | 0.83% | 90.13% | 134 | |
| 861 | 7 | 0.81% | 91.64% | 63 | |
| 1,364 | 11 | 0.81% | 93.99% | 92 | |
| 773 | 6 | 0.78% | 88.36% | 72 | |
| 1,160 | 9 | 0.78% | 82.84% | 132 | |
| 1,044 | 8 | 0.77% | 94.64% | 77 | |
| 1,441 | 11 | 0.76% | 81.54% | 208 | |
| 815 | 6 | 0.74% | 84.54% | 122 | |
| 1,091 | 8 | 0.73% | 89.09% | 140 | |
| 835 | 6 | 0.72% | 88.74% | 72 | |
| 861 | 6 | 0.70% | 91.52% | 215 | |
| 1,880 | 13 | 0.69% | 83.62% | 341 | |
| 1,165 | 8 | 0.69% | 90.56% | 192 | |
| 1,170 | 8 | 0.68% | 85.13% | 118 | |
| 586 | 4 | 0.68% | 80.55% | 162 | |
| 739 | 5 | 0.68% | 89.72% | 25 | |
| 1,538 | 10 | 0.65% | 95.64% | 18 | |
| 1,231 | 8 | 0.65% | 76.44% | 136 | |
| 619 | 4 | 0.65% | 83.20% | 74 | |
| 1,407 | 9 | 0.64% | 90.90% | 253 | |
| 981 | 6 | 0.61% | 87.26% | 123 | |
| 683 | 4 | 0.59% | 92.39% | 217 | |
| 861 | 5 | 0.58% | 90.59% | 190 | |
| 695 | 4 | 0.58% | 93.24% | 122 | |
| 3,152 | 17 | 0.54% | 91.09% | 366 | |
| 760 | 4 | 0.53% | 88.16% | 62 | |
| 1,145 | 6 | 0.52% | 93.97% | 98 | |
| 1,021 | 5 | 0.49% | 87.66% | 12 | |
| 1,338 | 5 | 0.37% | 78.25% | 34 | |
| 569 | 2 | 0.35% | 83.13% | 61 | |
| 906 | 3 | 0.33% | 93.38% | 59 | |
| 1,016 | 3 | 0.30% | 94.88% | 116 | |
| 1,017 | 3 | 0.29% | 89.77% | 60 | |
| 1,027 | 3 | 0.29% | 94.06% | 83 | |
| 4,062 | 11 | 0.27% | 95.45% | 1,128 | |
| 1,007 | 2 | 0.20% | 97.72% | 98 | |
| 1,027 | 2 | 0.19% | 92.79% | 153 | |
| 1,453 | 0 | 0.00% | 95.80% | 112 | |
| 105 | 0 | 0.00% | 93.33% | 30 |
No areas match. Clear the search or change the filter.
The interactive controls could not load. The table, charts and CSV downloads remain available.
How we calculated the comparisons
We downloaded the FSA’s complete English-language open-data file on 7 November 2026. Its published update time was 02:41 that day. The file contained 614,986 records with unique FHRS IDs. We excluded eight records belonging to the separate River Tees and Hull and Goole port authorities, leaving 614,978 records across 361 council areas. No private address or individual business details are republished in these aggregate downloads. This comparison was compiled by Level 2 Food Hygiene using the public data and the inclusion rules below.
England, Wales and Northern Ireland: 489,519 records had a numeric rating from 0 to 5. Ratings 0–2 form the numerator; 5 alone forms the top-rating measure. The denominator excludes 42,447 Awaiting Inspection records, 23,948 Exempt records and 53 Awaiting Publication records. These records are counted separately, not treated as zero-rated or as passing.
Scotland: 46,365 records had Pass, Pass and Eat Safe, or Improvement Required results. Improvement Required forms the numerator; the two Pass categories form the positive measure. A further 10,356 Awaiting Inspection and 2,290 Exempt records are excluded from that denominator. Scottish percentages and ranks are kept separate from FHRS.
Eligibility and ties: at least 100 rated records in the selected area and business group are required for ranking. All 329 FHRS councils and all 32 Scottish councils meet this threshold for the all-businesses comparison; some business-type subsets do not. Exact equal proportions share a rank; alphabetical order breaks display ties. Sorting uses unrounded values, so rounded numbers may look equal. These are descriptive snapshot rankings, not statistical significance tests or measures of council performance.
Pending new ratings: 3,709 FHRS records were flagged NewRatingPending. The dataset still contains their currently published rating; we retain it according to the same numeric-rating rule and display pending counts in the downloads. A pending flag can overlap with other statuses and must not be added to the denominator.
Rating dates: “more than three years old” means a published rating date before 7 November 2023. The percentage uses rated records with a date; three FHRS rated records had no date. A rating date is not a complete record of inspections. We make no claim about overdue inspections.
Geography and business types: checked FSA authority names are matched to ONS May 2024 council boundaries. Standardised map names and original FSA names are both preserved in the CSV. Business groups use the FSA categories unchanged. “All food businesses” includes categories beyond the six selectable sector comparisons. The full source describes records on the published register, rather than a census of every trading business.
The ratings can change after the snapshot. To check an individual business’s current result, use the official FSA ratings search. Food hygiene is one part of running a food business; see our restaurant industry statistics for the wider sector context.
Business-mix comparison: we calculated a low-rating share for each of all 14 FSA business categories across England, Wales and Northern Ireland. For each area, expected low ratings equal the sum of its rated count in each category multiplied by that category’s three-nation low-rating share. The reported ratio is observed low ratings divided by this expected count. Expected counts sum to the observed three-nation total, 14,842. These are internally standardised descriptive comparisons, with each area included in its benchmark; they are not causal estimates, food-poisoning probabilities or significance tests. No adjustment is made for other differences between areas.
Future comparisons: the original source snapshot and file checksums are archived with the analysis. A later edition can compare dated snapshots on consistent geography and categories. Rating dates alone are not used to reconstruct previous ratings.
About our food hygiene expert
Mark McShane is a chef, food nutritionist and HACCP and food hygiene consultant. His professional work includes food safety management, nutrition planning, menu development and staff training. Read Mark’s professional background.
Download the data and use the findings
The tables, charts and methodology are available for reporting. Please keep the reporting period, geography and measure with any figures you use.
Writing about this research?
Please credit Level 2 Food Hygiene and link to this study so readers can explore the figures and check the methodology.
Analysis by Level 2 Food Hygiene, based on Food Standards Agency ratings data, snapshot 7 November 2026. Food hygiene ratings by area: council comparisons.
Underlying official data retains its original licence and attribution requirements. Please identify our contribution as analysis of that data.
For a local breakdown or a question about the method, contact our team.
Sources and data links
Sources checked on 7 November 2026.
- Food Standards Agency open ratings dataSource catalogue and authority metadata. UK snapshot downloaded on 7 November 2026; source file labelled 02:41 that day.
- Complete FSA ratings CSV614,986 source records. This source link updates daily; our downloadable aggregates preserve the study’s dated snapshot.
- Food Hygiene Rating Scheme explainedOfficial meaning of ratings, assessment criteria and the scope of the scheme in England, Wales and Northern Ireland.
- Food Standards Scotland: Food Hygiene Information SchemeOfficial meanings of Pass, Improvement Required, Exempt and Awaiting Inspection. Scotland is analysed separately.
- FSA research on requested re-inspectionsBackground on risk-based controls and the three elements assessed. The study does not infer overdue inspections from a rating date.
- FSA terms for reusing ratings dataOpen Government Licence, attribution and the requirement to use a current rating or state when information was updated. No official rating badges are reproduced.
- ONS local authority boundaries, May 2024Generalised UK boundaries, joined to FSA authorities using checked name matches. Contains OS data © Crown copyright and database right 2026; ONS data © Crown copyright 2026.
- Public Health Technical Guidance: overview of standardisationMethodological background for observed/expected comparisons. Indirectly standardised ratios have area-specific weights; we do not turn the business-mix ratios into a cross-area league table.